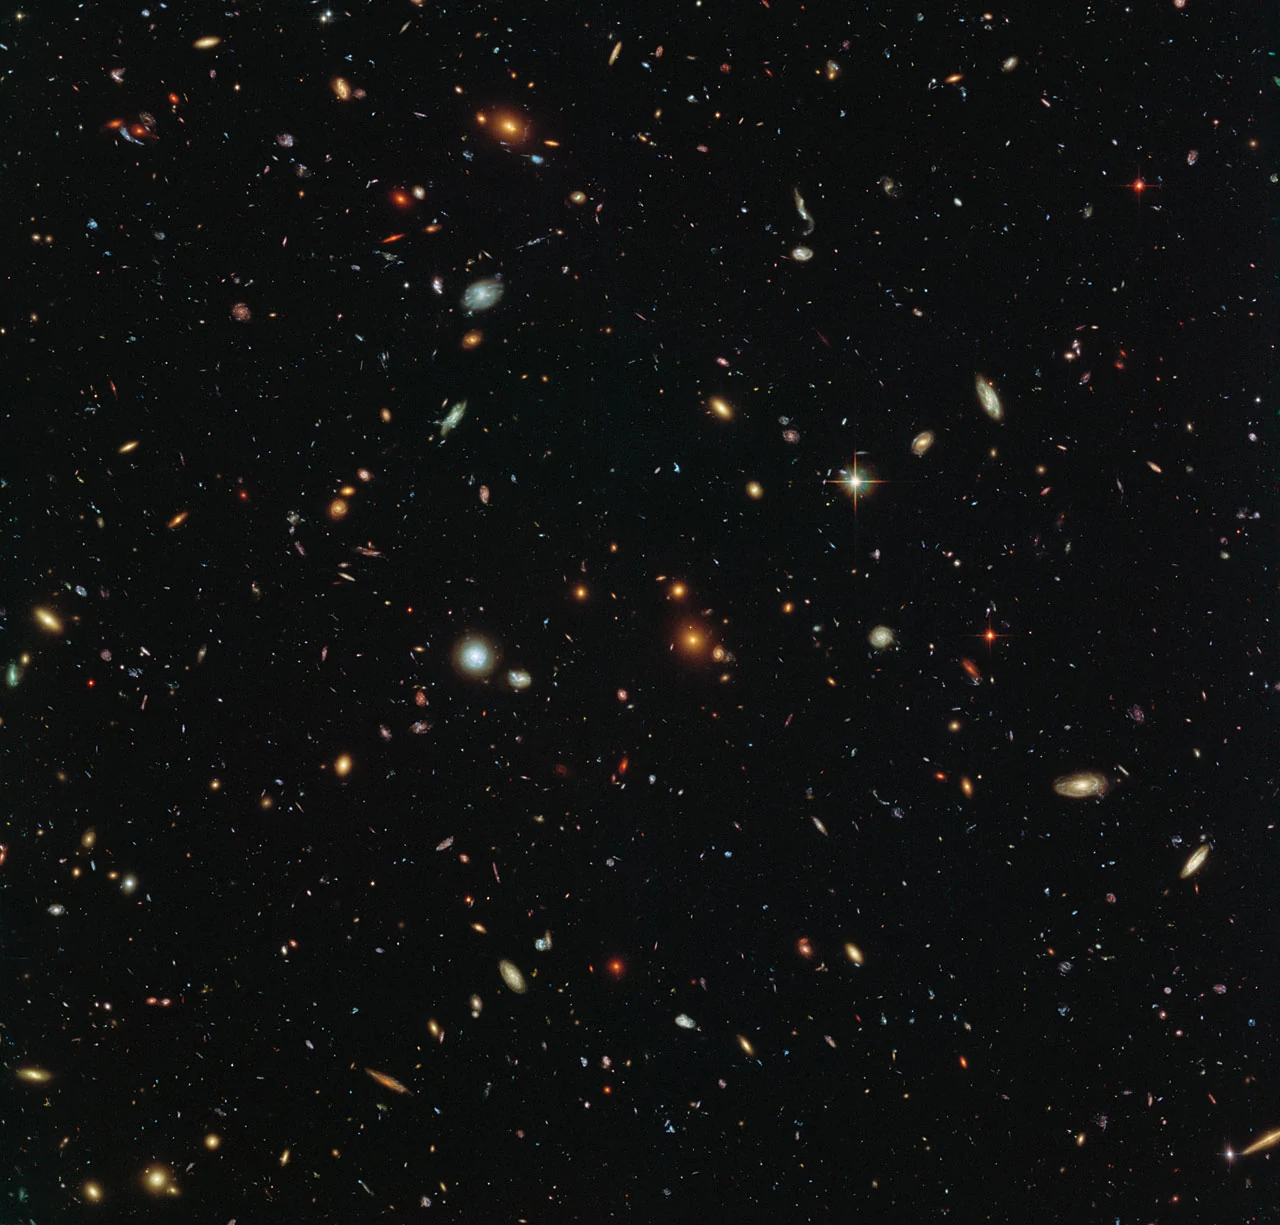
When you look at galaxies through a telescope — scattered across the field like grains on dark cloth — it’s tempting to think they’re placed at random. They aren’t. Galaxies live on a structure so vast that the only metaphor that survives at scale is a web: long filaments of matter, hundreds of millions of light-years across, connecting dense knots of galaxy clusters and skirting nearly empty voids. This month, the largest survey JWST has carried out gave us the clearest map of that web to date, tracing it back to a time when the universe was barely a billion years old.
The map
A team led by Hossein Hatamnia at UC Riverside and the Carnegie Observatories published their results in the Astrophysical Journal on May 6. The paper does something no previous survey could: trace the cosmic web from the local universe all the way to redshift z ≈ 7 — roughly 13 billion years into the past — in a single, continuous dataset.
They catalogued 164,000 galaxies across a patch of sky about 0.54 square degrees, roughly the area of three full Moons. For each galaxy, the team measured not just position and redshift but local cosmic density — whether it sits in a dense cluster, along a thin filament, or inside one of the near-empty voids between them.
The data, the analysis pipeline, and a time-lapse animation of the web evolving over billions of years are all publicly available. If you’re comfortable with Python and FITS files, you can slice the web by redshift yourself.
What the cosmic web is
Zoom out far enough and the universe doesn’t look uniform. Galaxies cluster along filaments — tendrils of dark matter and gas, hundreds of millions of light-years long — threaded between dense knots (galaxy clusters) and bordered by voids where almost nothing lives. The whole arrangement is the large-scale structure of the universe, and simulating it has been one of computational cosmology’s signature achievements since the Millennium Simulation in 2005.
The scaffolding is dark matter. After the Big Bang, tiny density fluctuations — imprinted in the cosmic microwave background — grew under gravity. Overdense regions pulled in more matter, forming sheets, then filaments, then clusters at the nodes where filaments meet. The baryonic matter (gas, dust, eventually stars and galaxies) followed. What we see today, 13.8 billion years later, is the galaxy-lit surface of a skeleton we can’t directly observe.
You can’t see the web through an eyepiece. Even pointing a 6-inch refractor at the Coma Cluster won’t reveal that Coma sits at one of the web’s densest intersections. But knowing it exists changes how you think about what you are seeing. That fuzzy elliptical galaxy in your field of view isn’t drifting free — it was pulled to its current position by a filament of dark matter that predates it by billions of years.
How COSMOS-Web pulled it off
The survey behind this work is COSMOS-Web, the largest contiguous area JWST has imaged so far. It used JWST’s NIRCam (near-infrared camera) and MIRI (mid-infrared instrument) to image the COSMOS field, a well-studied patch of sky in the constellation Sextans that ground-based observatories and the Hubble Space Telescope have been photographing for over two decades. Layering JWST data on top of that existing baseline gives the team both the depth of infrared space imaging and the multi-wavelength context of decades of ground-based photometry.
JWST’s advantage over Hubble here comes down to two things: sensitivity and wavelength coverage. NIRCam reaches deeper in the near-infrared than anything Hubble carried, detecting faint, high-redshift galaxies that Hubble’s optical CCDs couldn’t register. And the longer wavelength baseline lets the team measure photometric redshifts with tighter error bars, so each galaxy lands in the correct time slice. The 3D map sharpens as a direct consequence.
Hatamnia’s team applied a density-estimation algorithm across the full redshift range, z = 0.1 to z ≈ 7. At each slice they assigned every galaxy a local density value, telling you whether it sits in the densest 10% of its epoch — a protocluster or filament junction — or in a void. This isn’t a theoretical model fit to a handful of data points. It’s a direct, statistical measurement of 164,000 positions stretched across 13 billion years.
Why the map’s value is in what comes next
The cosmic-web maps look striking in press releases. But the real payoff is the science the dataset enables.
Astronomers have known since Alan Dressler’s work in the 1980s that galaxy morphology correlates with environment. Elliptical galaxies dominate clusters. Spirals prefer the field. This morphology-density relation is one of the most consistent patterns in extragalactic astronomy, and it holds in the local universe out to about z ≈ 1.
The open question is when the relation formed — and whether filaments themselves shape galaxy evolution, or only the clusters at their intersections do the heavy lifting. Ground-based surveys and even Hubble-era data lacked the depth and redshift precision to test this much beyond z ≈ 2. COSMOS-Web goes to z ≈ 7.
If a galaxy inside a proto-filament at z = 6 already shows signs of suppressed star formation compared to one in a void at the same epoch, that tells you the web’s gravitational influence kicks in far earlier than many models predict. It’s a direct observational test of how environment drives evolution, and it hasn’t been possible before at these redshifts.
The public data release is what makes this useful beyond one research group. Any team can now cross-match Hatamnia’s density catalog against star-formation rates, metallicities, AGN activity, or dust content measured by other surveys. The density catalog is a reference dataset. Expect dozens of follow-up papers over the next year or two.
An observer’s perspective
I think about this sometimes when I’m on my balcony in Nicosia, pointing the Seestar at the Virgo Cluster. On a good night I can pull out maybe 15 galaxies in a 60-second stack — M87, M84, M86, the chain of Markarian’s galaxies trailing off toward the northwest. What I can’t see is the filament feeding them. The Virgo Cluster sits at one of the most prominent nodes of the local cosmic web, roughly 54 million light-years (16.5 Mpc) from us. Every galaxy I’m imaging has been shaped by that node — pulled in, stripped of gas, morphologically transformed over billions of years by the cluster’s gravitational environment.
COSMOS-Web pushed that same structural mapping to z ≈ 7 — a time when the Milky Way’s own progenitor was still assembling from smaller clumps along whatever filament we happened to inhabit. Thirteen billion years of web evolution, from thin proto-structures in the young universe to the thick, mature filaments of the nearby cosmos, compressed into one survey.
What to watch next
Two follow-ups are worth tracking. First, the COSMOS-Web field will get deeper observations in JWST’s Cycle 4. Higher signal-to-noise on the faintest galaxies could extend the map to even higher redshifts, potentially reaching the epoch when the first filaments were just collapsing out of primordial density fluctuations.
Second, the Nancy Grace Roman Space Telescope will survey areas roughly 200 times wider than JWST can cover, though at shallower depth. The two instruments are directly complementary: JWST provides depth along a narrow pencil beam, Roman provides breadth across wide fields. Together, they’ll map the cosmic web from the Local Supercluster to the edge of what’s observable.
If you want to explore the data, the team’s public release includes the full density catalog and pipeline code. Download it, fire up a FITS viewer, and scroll through the redshift bins. Watching filaments thicken and clusters coalesce from almost nothing as you step forward through cosmic time is a different kind of stargazing — but it gets at the same question we all start with: how did all of this end up where it is?