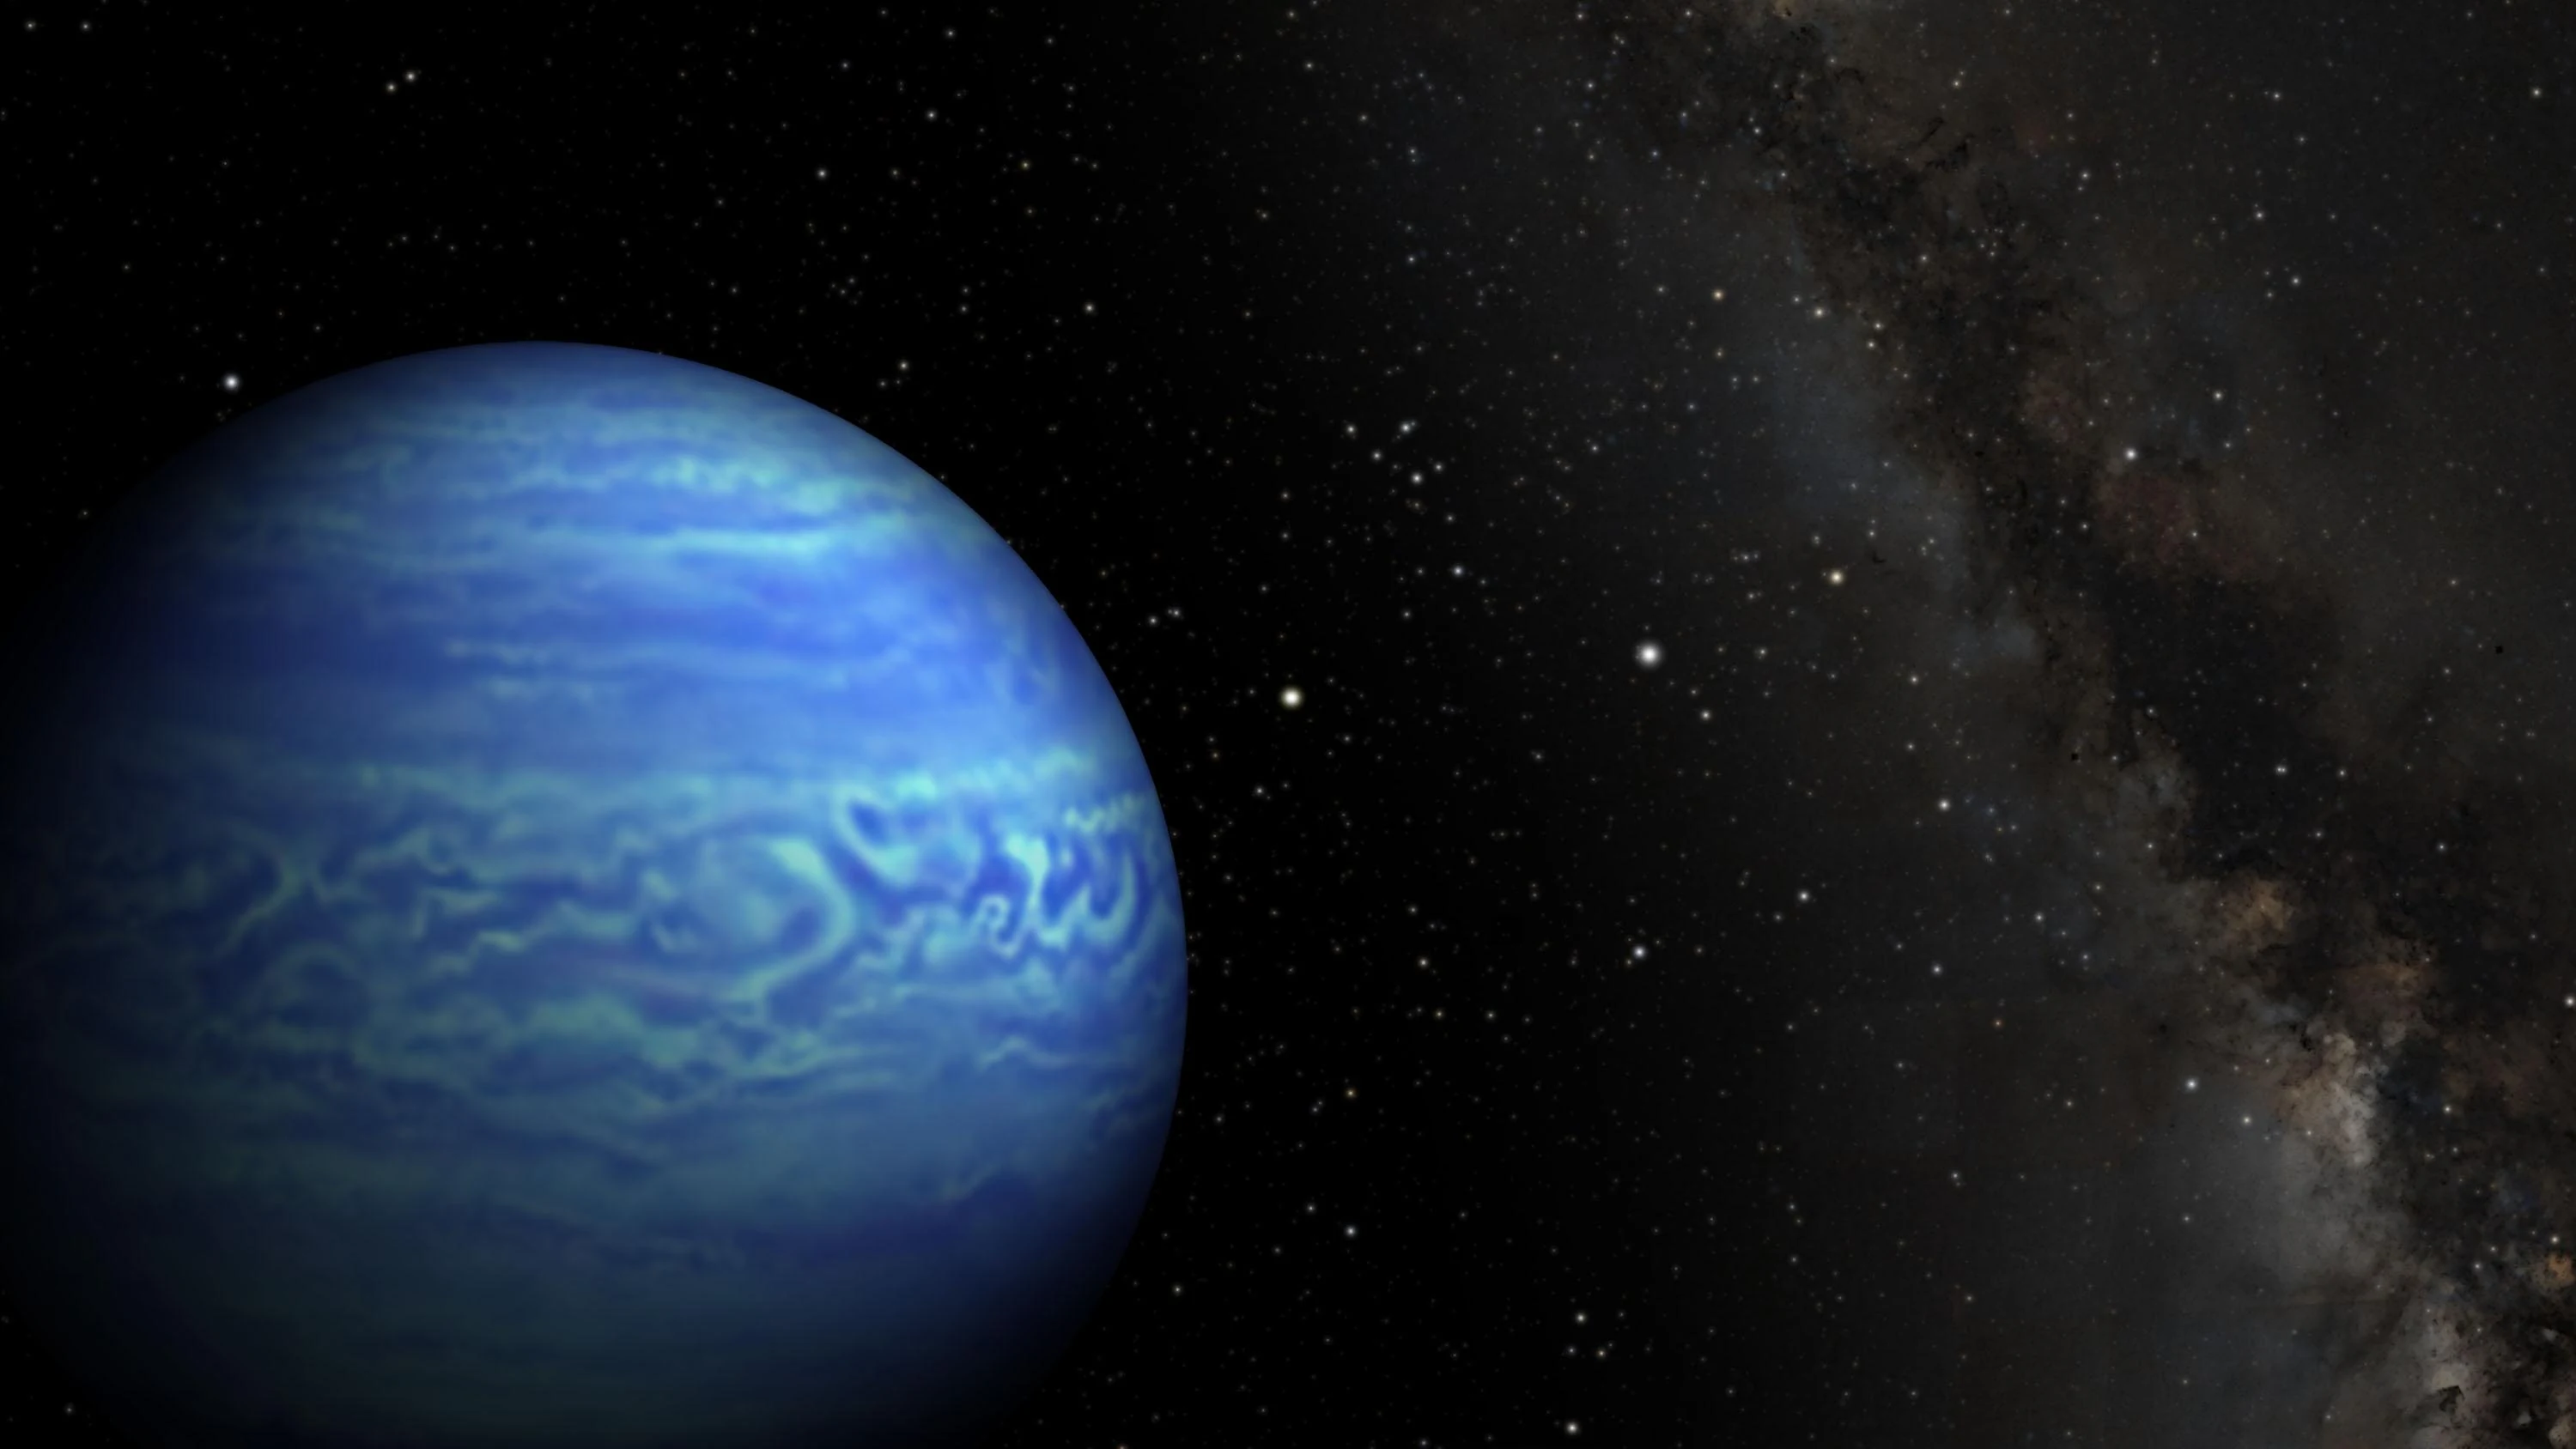
WISE 0855 is the coldest brown dwarf anyone has found, at about 265 K (−8 °C), and it sits 2.28 parsecs (about 7.4 light-years) from the Sun. A team led by Brittany Miles of the University of Arizona’s Steward Observatory pointed JWST’s NIRSpec spectrograph at it for 11 hours, taking a spectrum every 15 minutes. As the object rotated, the spectra changed in two separate ways. High in the atmosphere, the team finds patchy water clouds whose thickness varies from one side to the other. Deeper down, carbon monoxide and phosphine rise and fall together, which the team reads as temperature changes in gas welling up from the interior. The paper, “Water Cloud and Chemical Modulations in the Coldest Brown Dwarf”, is on arXiv and listed as accepted to The Astronomical Journal. The University of Arizona announced it on 9 October.
Water clouds on WISE 0855 have been suspected for more than a decade. The team says these data are the first to catch them changing.
A neighbour that radiates like Earth
Kevin Luhman found WISE 0855 in 2014 by noticing how fast it moves across the sky in data from NASA’s WISE survey, then pinning it down with Spitzer. He measured a proper motion of 8.1 arcseconds per year and a parallax that gave it, at the time, the third-highest proper motion and the fourth-largest parallax of any known star or brown dwarf. It is one of the Sun’s closest neighbours, and it gives off almost no visible light.
The temperature puts it in strange company. Earth’s effective temperature, the temperature of the light it radiates to space, is about 255 K. WISE 0855 at ~265 K is only slightly warmer than that. Jupiter, for comparison, radiates at about 125 K.
Mass is harder. Luhman’s evolutionary models gave 3–10 Jupiter masses for ages between 1 and 10 billion years, and nobody knows the age well. That range sits below the ~13 Jupiter-mass deuterium-burning line often used as the brown-dwarf floor. It gets the brown-dwarf label largely because it drifts alone, with no star to orbit, but by mass it’s in planet territory. Down here the labels get blurry.
The temperature also explains why it’s the best place to look for water clouds. On Jupiter, the white clouds you see through a backyard telescope are ammonia ice; water clouds exist, but they sit deeper, below the ammonia deck. WISE 0855 is warm enough that ammonia stays a gas and cold enough that water condenses near the top of the atmosphere, around 1.2–2.0 bar in the models the paper cites. If any object outside the Solar System shows weather made of water, it should be this one.
Twelve years of “probably clouds”
The case has gone back and forth since 2014:
- Faherty et al. (2014) made the first near-infrared detection and found the colours matched models with water and sulfide clouds.
- Other groups then showed that cloud-free models with tweaked chemistry could match the same photometry.
- Skemer et al. (2016) got the first spectrum, a low-resolution one from the ground, and a model with a grey opacity layer where water clouds should be fit better than a clear one.
- Esplin et al. (2016) monitored it with Spitzer for two 23-hour stretches and found 3–5% peak-to-peak brightness changes, but concluded that “robust evidence of such clouds is not yet available.”
- The first JWST spectrum, Luhman et al. (2024), was matched well by a cloudless model in the region previously cited as evidence for clouds. Their verdict was that clear evidence of water-ice clouds “has not been identified yet.”
- Kühnle et al. (2025) used JWST’s mid-infrared instrument and found water vapour depleted above the 3-bar level, which fits with condensation but doesn’t prove it.
Every one of those studies looked at a time-averaged spectrum, or at brightness changes in two broad bands. A cloud deck and a temperature change can produce the same average spectrum. With two broad bands you see that the object brightened, but not why.
What Webb did on 2 December 2023
The observation itself is almost three years old. NIRSpec ran in its Bright Object Time-Series mode for Cycle 1 program GO 2327, from 01:03 to 12:09 UTC on 2 December 2023. The G395M grating covered 2.87–5.27 μm (micrometres) at a resolving power of about 1,000, with a signal-to-noise ratio of 80–100 per spectrum. That gave 44 spectra at 15-minute intervals.
If you’ve ever built a variable-star light curve from smart-telescope stacks, the difference is easy to picture. A light curve through one filter tells you a star brightened by 0.1 magnitude. A spectrum at each point on that curve tells you which absorption lines deepened or faded while it happened, and that’s what lets you separate causes. NIRSpec gave the team the second kind of data for a world at 7 light-years.
What changed, and what the team concludes
The measurements first, separate from the interpretation:
- Brightness changes of 1% to 10% across the band over the 11 hours.
- The biggest changes are in the carbon monoxide absorption band (near 4.6 μm), up to 10% peak to peak.
- Wavelengths dominated by methane, ammonia and water vapour vary less than the overall light curve.
- Converted to Spitzer’s two bands, the JWST data show 4–6% peak-to-peak changes, similar to what Spitzer saw in 2015.
The team then used principal component analysis, a way of breaking a stack of changing spectra into a few independent patterns. One pattern accounts for 60.5% of the variability and looks like an overall change in temperature or cloud cover. The second carries 4.7% and mainly moves the CO and phosphine (PH₃) bands, and the two molecules rise and fall together.
The interpretation comes from fitting atmospheric models. Fitting the averaged spectrum, every model grid they tried fit better with water clouds than without. The best fit was a cloudy model from the coolTLUSTY grid with an effective temperature of 250 K. To reproduce the changes over time, the model needed the effective temperature and the thickness of the water clouds to vary together. Even that left the CO and phosphine swings too large, so those required abundance changes on top.
The picture they arrive at has two layers:
- Upper level: water clouds, probably water alone, with thinner patches. Where the cloud thins, you see deeper, warmer gas richer in CO and phosphine. Mark Marley, a co-author and director of the University of Arizona’s Lunar and Planetary Laboratory, described it in the university’s release: “It’s like looking at the world through a screen door, where the screen is filtering out some of the light.”
- Deep level: CO and phosphine are “quenched”, meaning convection carries them up from hot, high-pressure layers faster than chemistry can convert them. Because their changes move in lockstep, the team attributes them to temperature variations deep in the convective region rather than to a second, deeper cloud deck.
The temperature swings involved are small, roughly 1 K. Because the CO changes are large, the team argues we probably see WISE 0855 close to equator-on, with the variability coming from zonal jets at low to middle latitudes. That’s the same banded flow that gives Jupiter its belts and zones.
The press release calls this the first confirmation of water clouds changing thickness on a world outside the Solar System. The paper’s own abstract is more careful and speaks of “evidence of patchy water clouds.” I’d go with the paper. Two model families (PICASO and coolTLUSTY) disagree on details, including how high the clouds sit, and the cloud signature comes from model comparisons rather than a single diagnostic absorption feature. It’s the strongest case so far, and it rests on one 11-hour visit.
Nobody knows how fast it spins
The rotation period is still open. Within the JWST data, wavelengths beyond 3.7 μm show significant periods of 5.4–5.6 hours. But that’s about half the length of the observation, and longer periods also carry significant power. In the reanalysed Spitzer data, the first 2015 epoch shows a 9.33-hour period and the second shows nothing shorter than the observing window. A 2025 JWST search for exomoons around WISE 0855 by Wilson et al. fitted parts of its light curve and preferred periods longer than 14 hours.
The authors say they’ll need baselines longer than 20 hours, over several epochs, to tell rotation apart from evolving jets or planet-scale waves. Brown dwarf weather changes from one visit to the next, so a single snapshot can’t settle it. (Exomoon searches around isolated objects are their own story; I covered JWST’s search around LP 890-9 c last month.)
Two other firsts in the background
Phosphine was a puzzle on WISE 0855. It’s abundant on Jupiter and Saturn, and models predict it in cold brown dwarfs. Luhman’s 2024 JWST spectrum didn’t detect it. A reanalysis by Rowland et al. (2024), several of whom are co-authors here, pulled it out at about one part per billion, along with deuterated methane (CH₃D). Those were the first abundance constraints on either molecule in a brown dwarf atmosphere, and the deuterium-to-hydrogen ratio came out consistent with the protosolar value. The new paper’s models put phosphine below theoretical expectations, in line with the depletion seen in other brown dwarfs.
Can you see it from a backyard?
No, and the numbers show why. Wien’s law puts the peak of a 265 K body’s emission at about 11 μm, far into the thermal infrared. What little reaches visible wavelengths is far below anything an amateur camera records. Even WISE found it at 4.6 μm.
You can still point at it. Its full name, WISE J085510.83−071442.5, is its address: right ascension 08h 55m 10.8s, declination −07° 14′ 43″ at WISE’s epoch. It has since drifted by about 8 arcseconds a year. By my rough calculation, from Nicosia that patch of sky is 30–35° up in the southeast when morning twilight starts in late October, and it climbs higher each week as winter approaches. My Seestar could frame the field without trouble. It would show a scatter of ordinary stars, and somewhere among them a world at −8 °C with water weather that nothing I own can detect.
For me, the result shows how far the brown-dwarf field has moved. Twelve years ago the object was a moving dot in WISE images. Now there’s a two-layer weather model, a rough orientation and a list of what changes when. What’s still missing is a long, repeated look that can say how fast this world turns and whether its clouds look the same next year.