If you could park a spaceship near the white dwarf WD J1330+6435 and look at it, it would be pale chartreuse green. That’s the headline result of “Any colour you like: the diverse chromaticities of white dwarfs” by Mark Hollands, Boris Gänsicke, Pier-Emmanuel Tremblay and Detlev Koester, published in RAS Techniques and Instruments this October (arXiv:2610.18966). To the authors’ knowledge, no other star of any kind has been claimed to look green. The same paper finds a white dwarf 48 light-years away that would glow salmon-pink, others that come out yellow, cyan, purple and blue, and one less exciting result: across the roughly 150 white dwarfs within 20 parsecs of the Sun, the median one is white.
Nobody photographed a green star, though. The colours were computed from spectra, and the method is simple enough that it’s worth walking through before getting to the strange stars.
Why you’ve never seen a green star
Star colour normally tracks temperature, because most stars radiate close to a blackbody, the idealised glowing object whose spectrum depends only on temperature. Cool ones look orange (astronomers call them “red”), Sun-like ones white, hot ones pale blue. Betelgeuse and Antares look ruddy from my balcony in Nicosia even through the city haze, and Rigel and Sirius look faintly blue.
Green never appears because a blackbody spectrum is broad. Wien’s law puts the Sun’s emission peak at about 500 nm, which is green light. But the Sun also pours out plenty of red and blue on either side of that peak, and your eye adds the whole lot up as white. Slide the temperature up or down and the mix just tips toward blue or orange. There’s no blackbody temperature at which the blend lands on green.
So a green star needs a spectrum that’s badly not a blackbody: something has to carve big chunks out of the red and blue while leaving the middle alone.
How you turn a spectrum into a colour
The team used standard colour science, the same machinery that calibrates computer monitors. The steps, as laid out in section 2 of the paper:
- Multiply the star’s optical spectrum by the three CIE 1931 colour-matching functions, curves that model how the human eye responds to light, and integrate. That gives three numbers, X, Y and Z.
- Normalise them to get the chromaticity, a brightness-free colour coordinate. Astronomers will recognise this as a colour-colour diagram with different filters.
- Convert to the sRGB colour space your screen uses, scale the brightest channel to maximum, apply the sRGB gamma curve, and read off a hex code.
The brightness scaling is unavoidable. Even the faintest white dwarf in the paper has a surface luminance of about 2.3 × 10⁸ cd/m², and a bright HDR monitor manages a few thousand. So the hex codes give the hue correctly and the brightness not at all.
As a sanity check, the paper runs a solar model through the pipeline and gets RGB (255, 241, 236), a correlated colour temperature of about 5,870 K, and a white with a very slight warm tint compared to the 6,500 K white point of a standard screen. A pure-hydrogen white dwarf at 10,000 K comes out (200, 218, 255), pale blue. Both are what you’d expect, which is the point: the method reproduces the boring cases before it’s trusted on the odd ones.
What makes a white dwarf break the rule
A white dwarf is the leftover core of a Sun-like star, typically around 0.6 solar masses packed into something about the size of Earth. The coolest ones have atmospheres that reach around 1 g/cm³, about the density of water. In gas that dense, atoms are constantly jostled by neighbouring helium atoms, and their absorption lines, normally narrow, smear out over hundreds to thousands of ångströms. A single element can then absorb a whole colour band.
The team sorted the results by what’s in the atmosphere.
Carbon-rich white dwarfs, spectral class DQ, have carbon dredged up from the core by convection. At low temperatures it forms C₂ molecules whose Swan bands absorb right where the eye is most sensitive. Of the 36 DQs examined, the warmest are bluish, a few are pale purple, and most of the cool, “peculiar” ones (DQpec) are shades of pink.
The standout is WD J1011+2845, also catalogued as LHS 2229, 14.73 pc (48 light-years) away with an effective temperature around 4,300 K. Its distorted Swan bands crush almost everything between 400 and 600 nm, so most of the visible light it emits comes out beyond 600 nm. The computed colour is a deep salmon-pink, hex #FF8775, and the authors call it “likely the reddest star known in terms of perceived colour.”
Mixed hydrogen-helium white dwarfs that are faint in the infrared go the other way. At low temperatures, colliding H₂ molecules and helium atoms absorb strongly in the near-infrared and red, a process called collision-induced absorption. That pushes the light toward cyan, and one of the 15 such stars examined, WD J1251+4403, works out blue, with a colour temperature of 12,700 K, though the authors flag its noisy spectrum.
Then there are the polluted ones.
A green glow from eaten rocks
A white dwarf with metal lines other than carbon gets a Z in its spectral type. Those metals aren’t original to the star. They come from rocky debris, mostly asteroids and some comets, that fell onto the white dwarf from its old planetary system, and the paper notes that almost 2,000 such polluted white dwarfs are now known. Heavy elements sink out of a white dwarf’s atmosphere, so any metals you see were delivered recently by astronomical standards.
WD J1330+6435 is one of these. Its atmosphere is mostly helium, with traces of sodium, calcium and lithium. A 2021 study led by Hollands found lithium in four cool, old polluted white dwarfs, J1330+6435 among them, and read the element ratios as signs of accreted fragments of planetary crust. A separate 2021 analysis by Kaiser and colleagues also covered lithium in this star. Sky & Telescope’s write-up puts it about 280 light-years away; the paper itself doesn’t quote a distance.
The refitted model gives an effective temperature of 4,240 K, surface gravity log g = 8.22, and abundances relative to helium of log(Na/He) = −8.7, log(Ca/He) = −8.8 and log(Li/He) = −10.6. Two absorbers do the work:
- Sodium’s D lines near 589 nm, broadened enormously in the dense helium, soak up the orange and red.
- Calcium absorbs at the violet end.
What’s left peaks around 500 nm. The disc-integrated colour is #DDFFB8, and the centre of the modelled disc is a more saturated #D0FFB4. Hollands puts it more vividly in the Warwick press release: “The traces of sodium in the atmosphere of this white dwarf absorb the orange part of the spectrum, leaving behind a ghostly green glow.”
I like that the authors are open about the error bars on this. The spectrum of J1330+6435 is “somewhat noisy,” they write, so the exact chromaticity could differ a little. Their main check is that an older model of the same star, built with a cruder line-shape treatment that gave a cooler temperature, also comes out green (#EAFFA1). Two different fits giving the same hue is a better argument than any single hex code.
It isn’t the only green one, either. WD J0851+1543 and WD J1351+2645 also come out green, but paler, and the authors consider J0851+1543’s green “can be claimed reliably” because its spectrum has a higher signal-to-noise ratio. At the far end sits WD J2356−2054, a roughly 4,000 K white dwarf with so much sodium that it’s computed to be bluer than any blackbody can be. A star with a 4,000 K atmosphere that looks vivid blue is, to me, the strangest result in the paper. The authors suggest the green and blue stars are two points on a continuum, and that bigger samples of cool polluted white dwarfs should fill in the shades between.
Would it really look green?
There’s one caveat the hex codes can’t show. Every colour in the paper is defined relative to the white point of an sRGB screen, the D65 standard, which is close to a 6,500 K blackbody. Against that reference, J1330+6435’s light is green. Your visual system doesn’t keep a fixed reference, though. Stand on a planet lit only by that star and your eyes would adapt to its light, much as an incandescent bulb looks white once you’ve been in the room a few minutes. My guess is that a lone green sun would look less green than the hex code suggests. A green star seen next to a whiter one, or as a disc in a sky full of ordinary stars, would show the difference. The paper also frames its disc-integrated colours as the tint the star would cast on a white surface, which is a fair way to think about it.
The average white dwarf is white
The part of the paper I expect to last longest is the least flashy. The 20-parsec sample is complete within that volume, so it isn’t biased toward bright or unusual objects. The arXiv version counts 152 white dwarfs there (the press release says 151).
Five of them are far enough from the blackbody curve that a colour temperature isn’t meaningful. Two are yellow DZs, and three are pink DQpecs, LHS 2229 among them. That’s 3.4 (+1.7/−1.3) percent, or about one white dwarf in thirty. For the remaining 147:
- The median correlated colour temperature is 6,768 K, hex #F9F5FF, almost exactly the white point of a screen.
- 95% fall between 3,800 and 18,700 K.
So the usual artist’s impression of a white dwarf as a blue-white point is off. Hot, blue white dwarfs are more luminous and show up from farther away, so surveys limited by brightness collect too many of them. Count everything within 65 light-years and the typical white dwarf is white.
What you can see from a backyard
None of these colours are available at the eyepiece. As the paper notes in its introduction, faint stars seen through a telescope don’t show their true colours, because the eye’s colour discrimination collapses in dim light. A one-shot-colour camera doesn’t solve it either. A Seestar’s colour depends on its white balance and processing, and even professional survey images such as SDSS’s map the g, r and i filters onto blue, green and red, though the i band lies mostly beyond what the eye can see. That’s useful for science, but it doesn’t tell you what the star looks like.
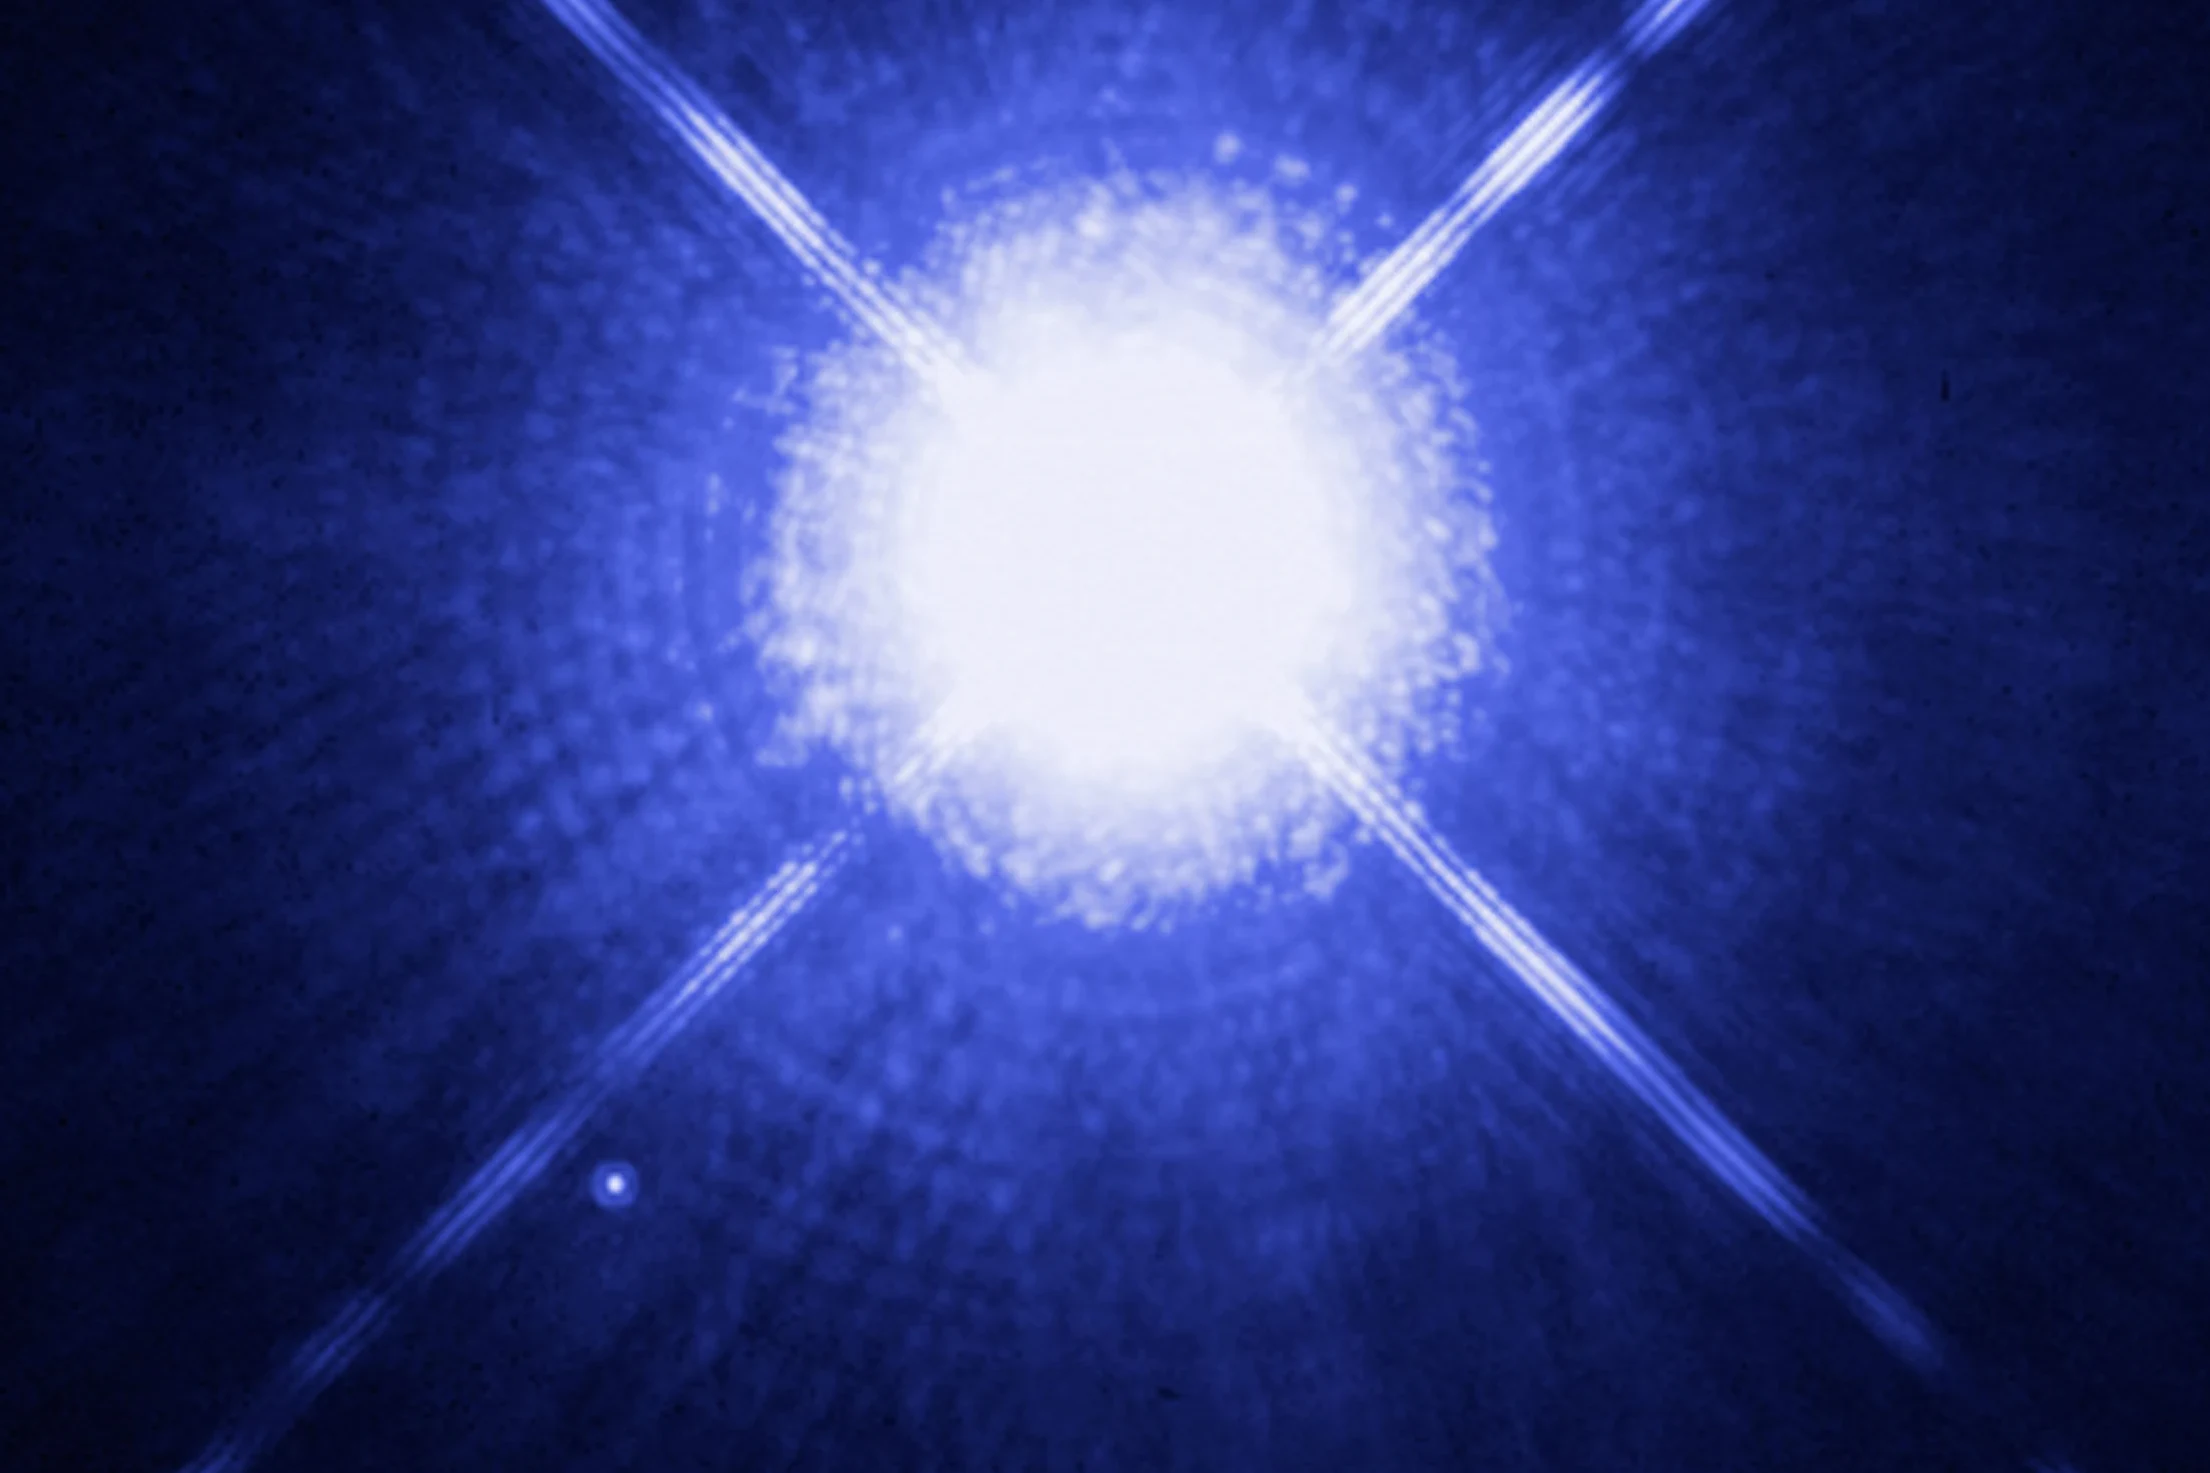
The cover of this post is a case in point. The deep blue in that Hubble image of Sirius A and B is a rendering choice. The paper’s calculation for Sirius B, a 25,970 K hydrogen white dwarf, gives #A4C1FF, a pale sky blue.
You can still go and see a white dwarf, even if you won’t see its colour. The easiest is 40 Eridani B. It’s magnitude 9.5 (apparent magnitude, where bigger numbers are fainter and the naked-eye limit under dark skies is about 6), about 16 light-years away, and sits roughly 83 arcseconds from the 4.4-magnitude 40 Eridani A, a separation I worked out from the Gaia DR3 positions. It’s well placed now. From Nicosia it culminates about 47° up at 01:21 EET on 1 November and around 23:30 by month’s end. The 11th-magnitude red dwarf 40 Eri C shares the system. In the paper’s table, 40 Eri B is a 16,265 K hydrogen-atmosphere star with colour #AECAFF, pale blue like Sirius B. It’s one of the roughly 97% of local white dwarfs that sit on the boring part of the curve, but it’s a real dead star you can find with a small telescope from a city balcony.
Sodium turns up at the other end of the mass scale too. The paper’s introduction cites earlier work predicting that brown dwarfs would look magenta to violet, mainly because of heavily broadened sodium D absorption. That’s the same mechanism that turns J1330+6435 green. (For a brown dwarf with its own atmospheric surprises, see the water clouds Webb tracked on WISE 0855.)
The authors expect the count of green white dwarfs to grow. “We’ll be getting a tenfold increase in the number of white dwarfs that have spectra,” Hollands told CNN, as new spectroscopic surveys start delivering data. “And so maybe if we’re lucky, we’ll go from one or maybe two green white dwarfs to 10 or 20.”